Posted 11/10/2026 CPI Food at home October 2026 Odyssey
October food-at-home CPI: the figure BLS couldn’t publish, and how we did
BLS published October's CPI today, and food at home rose 0.4% on the month, seasonally adjusted, or 0.35% before adjustment. What BLS couldn't publish is the figure we had been nowcasting: food-at-home inflation year on year. Our final nowcast, on data to 31 October, was 1.93%.
The reason is last year's government shutdown. BLS collected no prices in October 2025, so there is no October 2025 index to compare October 2026 with. For most CPI series, including food at home, BLS has published no 12-month change for October, and it won't publish one later.
Scoring October another way
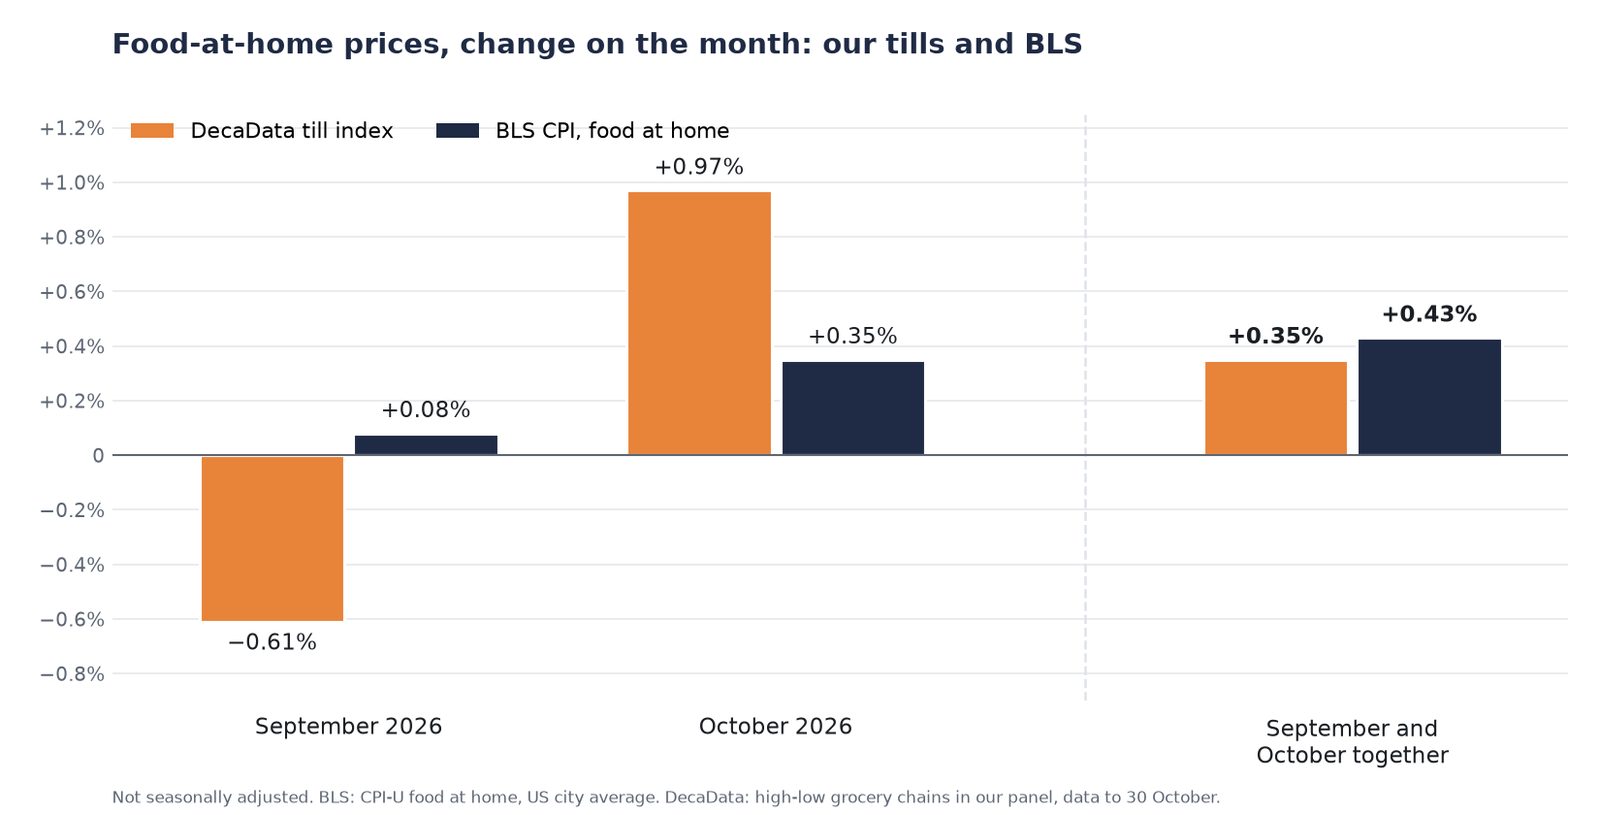
The fair test left is the change from September to October, which BLS did publish. Here our till data and BLS diverge month by month, and agree over two:
| Food at home, change on the month | DecaData index | BLS CPI |
|---|---|---|
| September 2026 | (0.61%) | 0.08% |
| October 2026 | 0.97% | 0.35% |
| September and October together | 0.35% | 0.43% |
BLS figures here are not seasonally adjusted, to match ours.
Our monthly changes swing far more than BLS's. Over the past two years, our month-on-month change has a typical swing of about 1 point, against about 0.3 for BLS. On a single month, our index misses BLS by more than simply assuming BLS's average change would. The chains in our panel run high-low promotions, and a month's figure depends on which promotions and weekends fall inside it. A weak month is often followed by a strong one, as in September and October. Over the two months together, the gap is under 0.1 points.
That is why our nowcast works on year-on-year changes, where these swings largely cancel out, and why a single month's change is a poor yardstick for it. October's monthly figures are consistent with our nowcast: BLS's September figure was 1.81%, and October was a firm month at the tills. That is as far as the evidence goes.
A warning for November
BLS publishes November's CPI on 10 December, and this time it will publish a year-on-year figure. It will likely run high. BLS's November 2025 food-at-home index is unusually low: it fell 0.66% from September 2025 and then rose 0.54% in December. That pattern reflects how prices were filled in after the shutdown, not what shoppers paid.
A low base makes the year-on-year change look higher. If food-at-home prices rise at an ordinary pace in November, BLS's 12-month figure could come out near 3%, roughly a point above the underlying rate.
Our nowcast starts from BLS's latest published figure and adds what our tills say has changed. Our tills recorded actual November 2025 prices, so they don't contain this base effect. When we publish November's nowcast, we will say how we account for it.
To follow the nowcast, or for a sample of the till data behind it, get in touch.
© DecaData • Terms • @Deca_Data on X • • Privacy opt-out