Posted 11/17/2026 CPI Food at home November 2026 Odyssey
November food-at-home CPI: 1.9% underlying, about 2.5% as printed
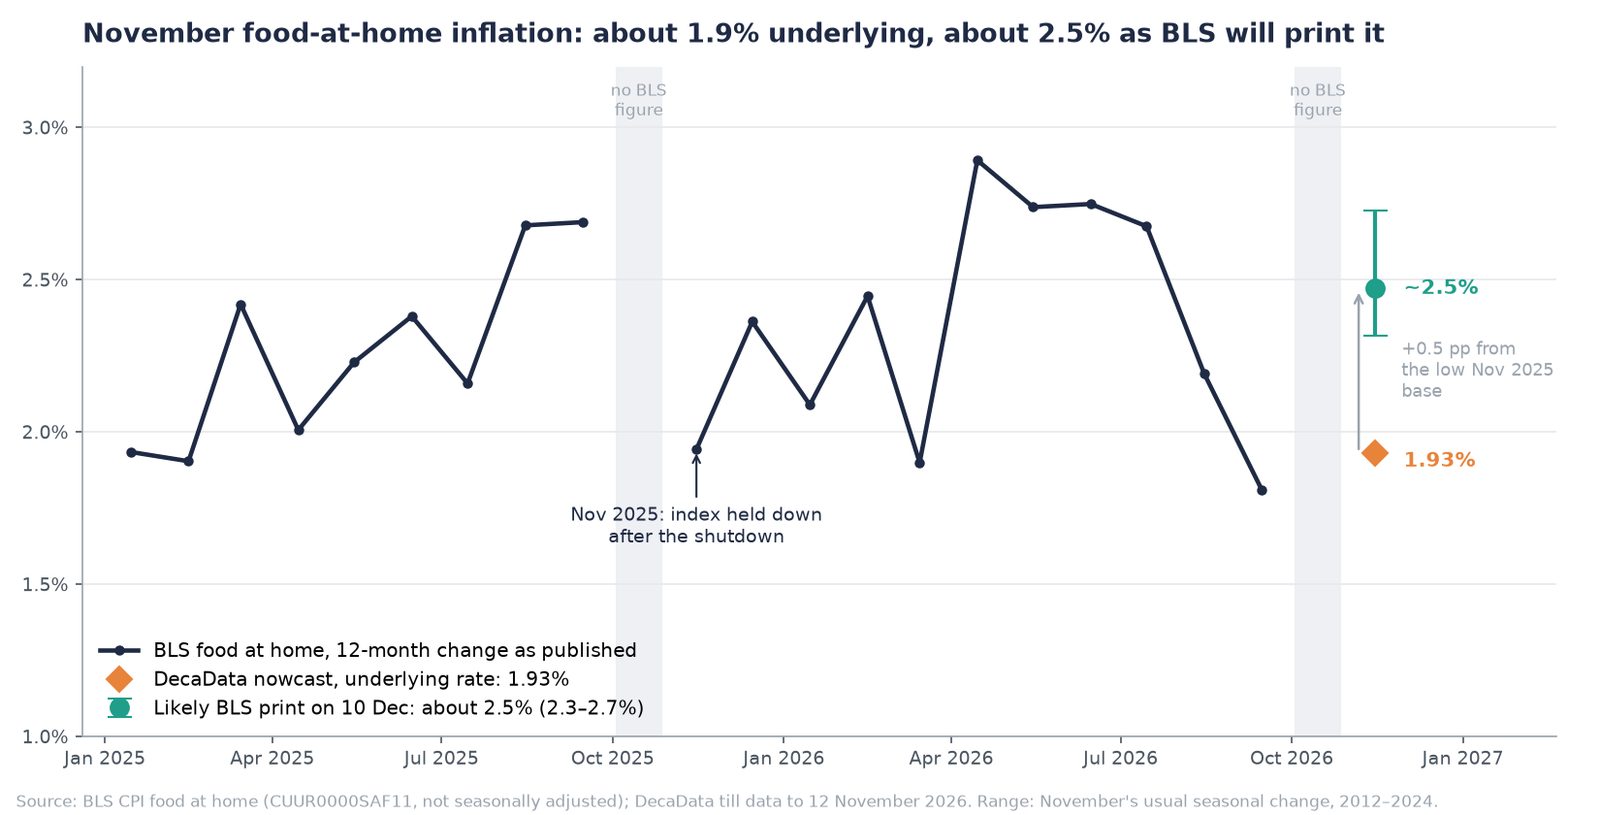
Our nowcast of November's food-at-home inflation is 1.93% year on year, on till data to 12 November. That is our read of the rate shoppers are actually paying. The figure BLS publishes on Thursday 10 December will most likely be higher: about 2.5%, in a range of 2.3% to 2.7%.
The gap isn't a disagreement about prices. It comes from the month BLS will compare November with, as we warned when October's CPI came out.
Why BLS's November figure will run high
BLS collected no prices in October 2025 because of the government shutdown, and its food-at-home index for November 2025 came out unusually low: 313.954, down 0.66% from September 2025, before it rose 0.54% in December. In a normal year, food at home slips about 0.2% between September and November. On that pattern, November 2025 would have been about 315.4. The published figure is 0.46% below that.
A 12-month change measured from a low starting point reads high. Added to our 1.93%, the low base gives 2.40%.
We reach the same place from the other end. BLS's October 2026 index is 322.876. Food prices usually ease from October to November before seasonal adjustment, as stores run holiday promotions: the median change since 2012 is −0.29%. That puts November 2026 at about 321.9, which is 2.54% above November 2025.
| Route to BLS's November figure | Estimate |
|---|---|
| Our underlying rate, plus the low base | 2.40% |
| BLS's October index, plus November's usual change | 2.54% |
| BLS's October index, plus our tills' change so far (−0.41%) | 2.42% |
| Central estimate | about 2.5% |
The range of 2.3% to 2.7% comes from how much November's seasonal change has varied: in the middle half of years since 2012 it was between −0.51% and −0.11%. Our tills' month-on-month change swings more than BLS's, and November's is based on 12 days, so we give that route less weight.
In our last post we said BLS's figure could come out near 3%. That assumed prices would hold level from October. November is usually a soft month before seasonal adjustment, which brings the likely figure down to about 2.5%.
How the nowcast has moved
| Data through | Nowcast (underlying rate) |
|---|---|
| 7 November | 1.88% |
| 8 November | 1.90% |
| 9 November | 1.93% |
| 10 November | 1.94% |
| 11 November | 1.89% |
| 12 November | 1.93% |
So far it has stayed between 1.88% and 1.94%, close to our final October figure of 1.93% and above BLS's September figure of 1.81%. We will update it as the rest of November's data comes in, and on 10 December we will score both numbers: the underlying rate and our estimate of the published figure.
To follow the nowcast as it updates, or for a sample of the till data behind it, get in touch.
© DecaData • Terms • @Deca_Data on X • • Privacy opt-out